I do not write a lot for two reasons. Laziness takes the first place. Second reason is even crazier. I don’t write until I have something that I feel is compelling (Of course…for me) to overcome that laziness. In the past, I have said that Standard Deviation is more important than your significant other. In the recent weeks, as I talk to my people I have realized how unaware people are when it comes to Standard Deviation – thanks to our engineering colleges. So I started coaching them with the poor statistical background I have. As it happens, I encountered a lot of questions for which I had no reply other than a sheepish smile. It turns out I was explaining things too fast so people could not understand. If a student does not learn then teacher does not teach it well. So here I go one more time.
Why do we need standard deviation? We want to know how far we are from the mean. Now, why is that important? Our specifications are ideal. The real world varies from your specifications. You want this variation to be zero but that is not going to happen so we try to accommodate those. To accommodate those you need to know how far you are from the ideal. The “how far” is variance. Standard Deviation (SD) measures the variance. That’s why it is important. SD is denoted with the symbol σ (Sigma). Now don’t jump into 6σ yet. We have a long way to go. Before that, let’s understand SD better.
I’m going to use an example away from Quality intentionally to keep our minds away from 6σ. Let’s say I have an average daily demand of 25 units for an item. Again, the average is 25. This is how the orders came in on each day.

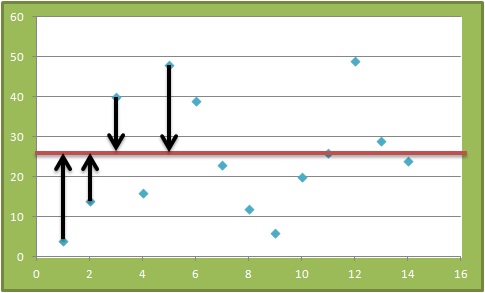
You can clearly see that the orders are away from the average. Some are 5 units away from the average, some are 10. You know we are away from the average of 25 for each day. Does this tell you the overall picture?
To get the overall picture we need to find the average distance from our red line (average of 25). How do you get the average distance? Add up all the distances and find the average. Nope…there is a catch. There are some negatives. These will cancel out the other ones and you will end up with zero.
How do you overcome this?
Exactly…
You take the absolute (remove the sign) and add up everything to find the average
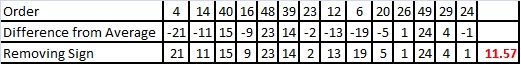
This tells you that the orders can vary up to 11.57 units on an average. The number you find by this method is Mean Deviation
or
You can square up all the values which would make everything positive and then find the average. Can you leave it like this? Probably not. For example, if you are measuring length, squaring the values squares the unit too. Squaring length will result in area (cm to cm2). To get back to the original unit, we need to find the square root. So find the square root to get your average distance from the target.
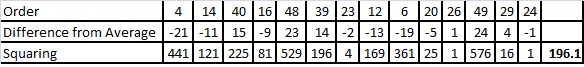
Square root of 196.14 = 14.01. This number is called Standard Deviation—Average of the distances from the average
The more extreme values you have, the difference between MD and SD will be higher. SD tends to exaggerate extremes because of squaring.
Which method is better? Both are. This has been the subject of a long debate among mathematicians. Since the second method works better in a normally distributed data, it has prevailed. So we started using Standard Deviation to measure variation.
An easy way to calculate SD in excel is to use the formula STDEVP().
Now that you know how to calculate SD or Sigma , what are its uses in Quality and Inventory. That’s in the next post.

 RSS Feed
